

Author: Curie, Shenchao TechFlow
Shenchao Introduction:
On November 16, Michael Saylor, founder of Strategy, publicly recommended the official Bitcoin data dashboard and highlighted four key indicators for assessing the current market situation. Data shows that the current Bitcoin price has fallen below the 200-week moving average, and historically it has only traded below this average 5.6% of the time; over the past 30 days, spot ETFs have seen cumulative net outflows of 2.919 billion USD, and the Fear and Greed Index has simultaneously dropped to the extreme fear range of 10. At the same time, Bitcoin's market share has risen against the trend to 66.9%. This means that defensive withdrawals by off-exchange institutions have pushed short-term market sentiment to freezing point, while long-cycle quantitative valuation indicators have also simultaneously entered a historically rare low range.

Amid intense bullish-bearish contention in the market, Bitcoin's biggest bull chooses to measure the cycle with the most basic on-chain and macroeconomic data.
On November 16, Michael Saylor, founder of Strategy, posted on social platform X that to see clearly what is happening with Bitcoin, one must first start from the data. He also released the latest screenshot of Strategy's official Bitcoin dashboard and specifically circled four core data points with orange borders, covering long-term cost averages, institutional fund inflows and outflows, sentiment preference, and ecosystem market cap structure.
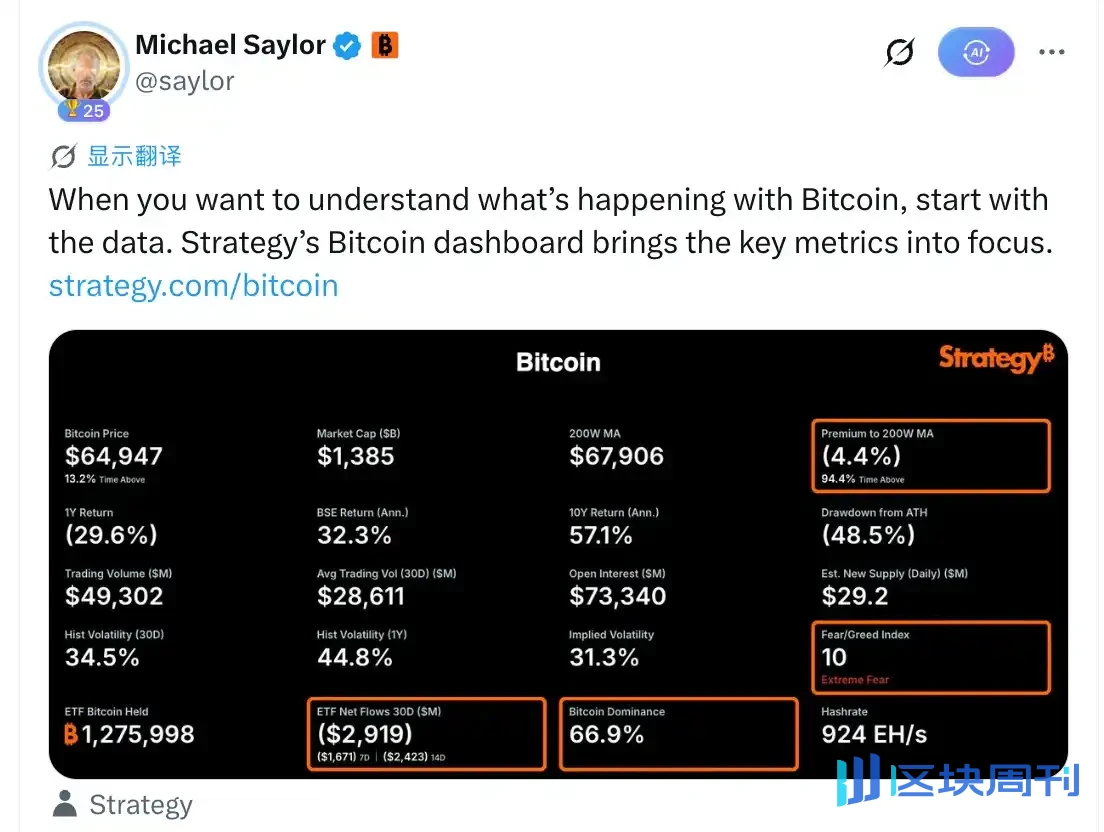
Current Price Falls Below 200-Week Moving Average, Historically Only 5.6% of Time Spent at This Level
The first item marked on the dashboard is long-cycle price deviation.
According to Strategy dashboard data, the current Bitcoin price is 64,947 USD, while its 200-week moving average (200W MA) is at 67,906 USD, and the premium rate of the price to the 200-week average is -4.4%.
The data also shows that in Bitcoin's historical trading time, 94.4% of the time the price was above the 200-week moving average. In crypto quantitative models, the 200-week moving average is usually regarded as the long-term valuation watershed across multiple bull-bear cycles. Falling below this average often means that secondary market prices have deeply given back the short- and medium-term speculative bubble and returned to near the long-term average cost line of underlying holders.
ETFs Withdraw 2.9 Billion USD in 30 Days, Fear Index Drops to 10
Corresponding to the breach of the long-term moving average is the continued withdrawal of off-exchange institutional funds.
According to the ETF fund flow indicator tracked by Strategy, over the past 30 days, spot Bitcoin ETFs have seen cumulative net outflows of 2.919 billion USD. Looking at a shorter time frame, outflows were 2.423 billion USD in the last 14 days and 1.671 billion USD in the last 7 days, showing that institutional reduction actions have become somewhat concentrated recently.
The heavy pressure on the funding side has directly transmitted to market sentiment. The latest reading of the Fear/Greed Index on the dashboard is only 10, marked as "Extreme Fear." This indicator combines volatility, trading volume, social media热度, and Google Trends; falling to 10 indicates that selling and risk-aversion sentiment in market positions have been cleared to a阶段性 extreme.
However, the derivatives market has not completely gone silent. Dashboard data shows that the current total open interest in Bitcoin futures contracts across the network is still as high as 73.34 billion USD, reflecting that funds from both bulls and bears remain densely accumulated around the 64,000 USD level.
Market Share Rises Against the Trend to 66.9%, Funds Accelerate Herding During Pullback
The fourth dimension specifically marked is the differentiation of capital structure within the crypto ecosystem.
Data shows that Bitcoin Dominance has currently climbed to 66.9%. In terms of overall market performance, Bitcoin's current price has retraced 48.5% from its all-time high (ATH), and its cumulative return over the past year is -29.6%.
This contrast shows that against the backdrop of a broad sharp correction across crypto assets, funds are draining comprehensively from altcoins and retreating to Bitcoin for liquidity shelter. Bitcoin's market share approaching 67% is not due to its own absolute rise, but is the passive result of altcoin liquidity facing even more severe compression.
The indicators Saylor picked out are actually the kind of commonly repeated metrics that most people do not follow with discipline every day. But viewed together, they indeed combine the long-term valuation average, institutional fund flows, market sentiment, and capital preference.
Once these four sets of data are understood, the true position of the current market within the long cycle also becomes clear. At a time when AI monitoring is not difficult, for traders still in the market, going through this data once a day via an AI daily report makes it easier to gauge the market's temperature.